CT Cloud Analyze - User Guide
Overview
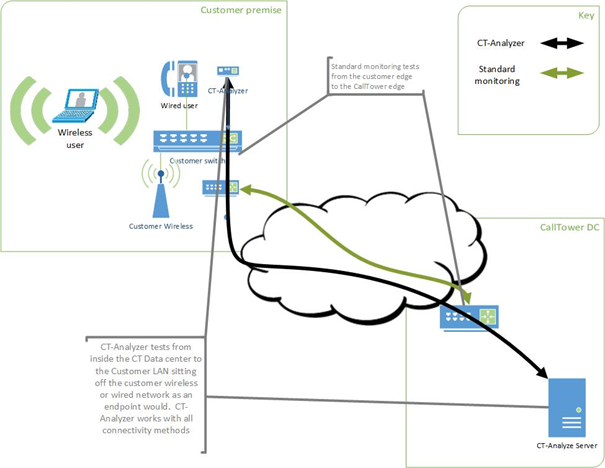
CT-Analyzer is a remote sensor placed in the customer’s network where a phone or Softphone enabled computer would sit. This differentiates it from other monitoring which only tests to the customer’s router or internet connection. The sensor can connect to the network over Wifi or be plugged directly into a switch port. CallTower recommends the sensor connect to the network using the same method used for the majority of phones / softphones. Simulated voice traffic is sent to the sensor every 30 seconds and mirrored back to the monitoring server in CallTower’s data center. Real-time and historical QOS data is available in the dashboard, and alerts can be configured for any detected problems.
Deployment instructions
Bronze
The sensor sits on the customer network in the same manner as a phone or PC would. Follow the steps below to set up the CT Cloud Analyze sensor.
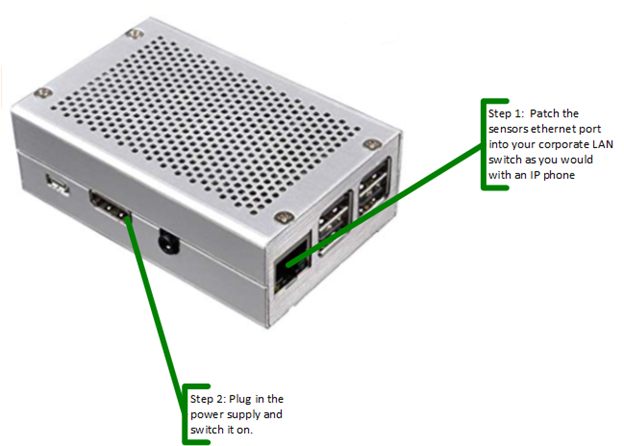
- Plug the ethernet port of the sensor (shown in the diagram below) into a switchport on your corporate LAN and connect power. NOTE: Additional configuration will be required if DHCP is not available on that port and there are rare cases where a port may have to be opened for customers with restrictive firewall settings. Please contact support@calltower.com with additional questions or for assistance.
- Contact support@calltower.com to enable the sensor in the management interface.
- Navigate to https://analyzer.calltower.com and test logging in with your CallTower provided credentials.
Silver
The sensor sits on the customer network in the same manner as a phone or PC would. Follow the steps below to set up the CT Cloud Analyze sensor.
- Plug the ethernet port of the sensor (shown in the diagram below) into a switchport on your corporate LAN and connect power. NOTE: Additional configuration will be required if DHCP is not available on that port and there are rare cases where a port may have to be opened for customers with restrictive firewall settings. Please contact support@calltower.com with additional questions or for assistance.
- Contact support@calltower.com to enable the sensor in the management interface.
- Connect the network interface dongle to a mirror or SPAN port on the LAN switch. NOTE: CALLTOWER RECOMMENDS CONNECTING THIS INTERFACE AND RECONFIGURING ANY CUSTOMER NETWORK EQUIPMENT IN A MAINTENANCE WINDOW OUTSIDE OF NORMAL BUSINESS HOURS
- Navigate to https://analyzer.calltower.com and test logging in with your CallTower provided credentials.
Gold
The sensor sits on the customer network in the same manner as a phone or PC would. Follow the steps below to set up the CT Cloud Analyze sensor.
- Plug the ethernet port of the sensor (shown in the diagram below) into a switchport on your corporate LAN and connect power. NOTE: Additional configuration will be required if DHCP is not available on that port and there are rare cases where a port may have to be opened for customers with restrictive firewall settings. Please contact support@calltower.com with additional questions or for assistance.
- Contact support@calltower.com to enable the sensor in the management interface.
- Navigate to https://analyzer.calltower.com and test logging in with your CallTower provided credentials.
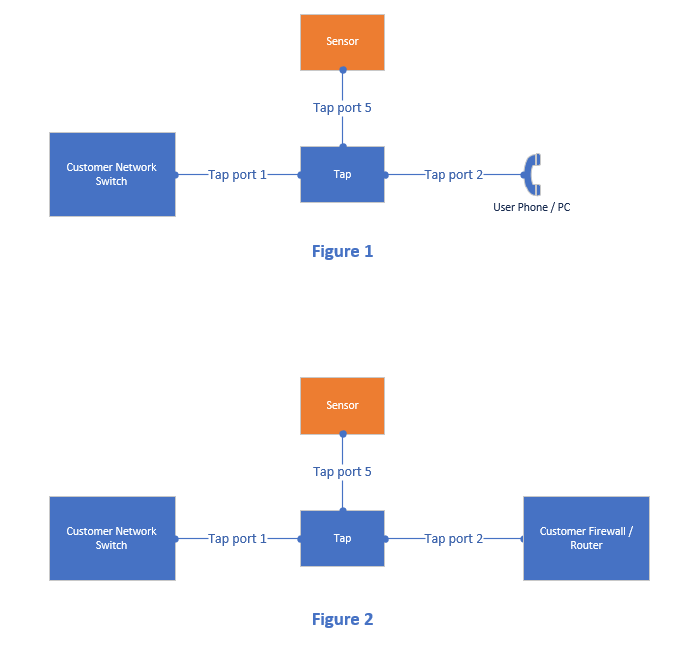
- The Tap is not typically installed into the network unless trying to actively troubleshoot an issue. Depending on the size of the network and traffic flows, it can be installed between the Local Area Network switch and router, switch and firewall, or if troubleshooting a single device, between that device and the rest of the network. See the diagram below for cabling instructions. The Tap should only be connected between the customer's switch and firewall or router on smaller networks. On larger networks, the Tap may cause packet loss if not able to keep up with the volume of network traffic. Escalate to CCE or Net for assistance if unsure where in the network to advise the customer to install the Tap. NOTE: CALLTOWER RECOMMENDS CONNECTING THE TAP AND / OR RECONFIGURING ANY CUSTOMER NETWORK EQUIPMENT IN A MAINTENANCE WINDOW OUTSIDE OF NORMAL BUSINESS HOURS
Monitoring application
User Guide
To access the monitoring application, navigate to https://analyzer.calltower.com and log in with your CallTower provided credentials.
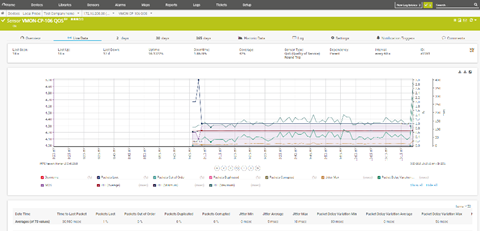
After logging in you will be presented with a list of sensors for your account. Click on the name of a sensor to select it from the list. Ping sensors report on the Minimum and Maximum Round Trip Time (RTT) and percentage of Packet Loss. QoS sensors provide additional statistics on simulated voice calls as described below. To return to the list, click on Sensors, All on the top menu bar.

On the sensor page you will be presented with a dashboard, historical graphs, and data.
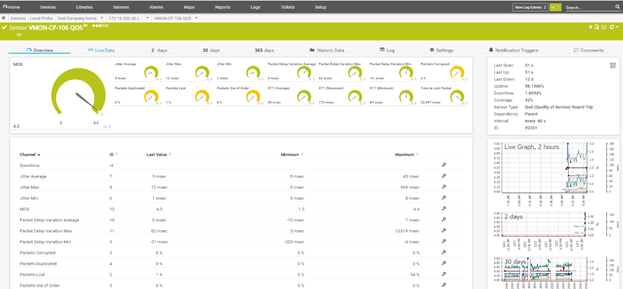
The following QOS values are monitored:
- Jitter: Jitter is defined as a variation in the delay of received packets. Excessive Jitter will typically manifest itself as what most people will describe as ‘static’ or robotic sounding. There are separate data points kept for Average Jitter, Maximum Jitter and Minimum Jitter. There are also data points kept for Packet Delay Variation average, Minimum and Maximum
- Packets corrupted: This is a measurement of the percentage of packets received that were corrupted. Excessive packets corrupted will typically manifest itself as what most people would describe as calls breaking up.
- Packets duplicated: This is a measurement of the percentage of packets that were duplicated by something in the call path.
- Packets Lost: This is a measurement of the percentage of packets that were lost at some point in the call path. Excessive packet lost will typically manifest itself as what most people would describe as calls breaking up.
- Packets out of order: This is a measurement of the percentage of packets that were received out of order. Excessive packets out of order would typically manifest itself as what most people would describe as calls breaking up.
- RTT: This is a measurement of the time in milliseconds that it took a packet to make the entire round trip to the customer site and back to the CT data center. Also commonly referred to as latency. Excessive latency will typically manifest itself as what most people describe as people talking over each other. There are separate data points kept for average Maximum and Minimum RTT
- MOS or Mean Opinion score: MOS is an overall measure of call quality. The range is from 1 to 5 with 1 being the worst and 5 the best. A MOS score of around 4.2 is typical for a high-quality voice call with no issue detected. MOS is determined by taking into account Jitter, Packet Loss and Latency.
Sensor Charts
You can click on any of the charts to open the chart in a larger window. You can also scroll down to see the data in table format.
Historical Data
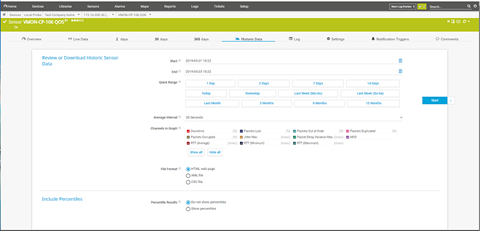
To review data for a specific period of time, use the Historical data tab. You can use the default quick range buttons or fill in a specific start and end time. You can also set the interval to limit the amount of data included in the report. If desired, change the report format by selecting HTML, XML, or CSV under File Format. Click Start to generate the report.
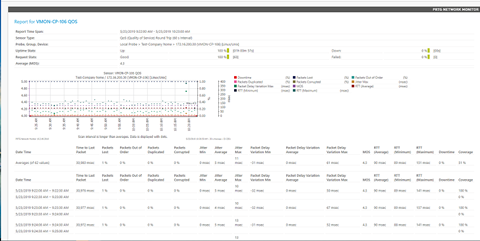
The following is an example of the report generated as an HTML page
Alerts
To configure email alerts when an issue is detected, contact CallTower support at support@calltower.com. Include the name of the sensor(s) and the metrics listed above that should trigger alerts. Please let us know if you want to use non-standard warning or alarm values for the alerts. Lastly, provide the email address that should receive the alerts.
Table1 displays the monitored values for QOS as well as the default warning and alarm values
Table 1
|
Name |
Default warning value |
Default alarm value |
|
MOS |
3.8 |
3.5 |
|
Jitter Average |
28ms |
30ms |
|
Jitter Max |
28ms |
30ms |
|
Jitter Min |
28ms |
30ms |
|
Packet Delay Variation Average |
|
|
|
Packet Delay Variation Max |
|
|
|
Packet Delay Variation Min |
|
|
|
Packets Corrupted |
1% |
1% |
|
Packets duplicated |
1% |
1% |
|
Packets Lost |
1% |
1% |
|
Packets Out of order |
1% |
1% |
|
RTT (Average) |
250ms |
300ms |
|
RTT (Maximum) |
250ms |
300ms |
|
RTT (Minimum) |
250ms |
300ms |
|
Time to Last Packet |
|
|
